
Conversion tracking monitoring is a daily reconciliation between what happened in the business and what your measurement destinations received. Count paid orders or valid leads in the system of record, count the matching events at each destination for the same window, and look at which IDs are missing, unexpected or repeated. Server request logs then show where a missing event stopped.
Tracking dies without making noise. On a Brazilian client stack I monitor, a site change at about 17:00 Brasília time on 2026-09-09 started sending the customer email to the data layer as a SHA-256 hash. The server container used that email as the key to look up browser context for each payment webhook, so every new lookup silently came back empty. GA4 purchase coverage, meaning GA4 purchases as a share of the bank’s paid deposits for the same day, went from 97% to 67% that day, 26% the next and 18% on the third. The bank side stayed normal, Stape’s outgoing requests kept returning 200, and every pixel kept firing. My settled check, which judges a day two days back, first paged at 08:15 on 2026-09-11, about 39 hours after the change.
Nothing was “down”, which is why only a comparison with the business count could see it.
Every component can look healthy while tracking fails
Each system judges itself. WordPress serves the page after a plugin disappears. A GTM workspace stays published even when its snippet is gone. A server container receives requests while one destination rejects its tag. In the incident above, browser events, webhook triggers and outgoing requests were all flat; only the join between them had broken.
None of those systems knows the business expected a certain number of events today. That expectation is the monitor, and it has to sit outside the delivery path. Otherwise zero events look like a quiet day, a green container hides rejected requests, and an expired token breaks nothing a customer can see.
A one-time QA checklist ages for the same reason. It proves the setup on the day you ran it and says nothing about tomorrow’s plugin cleanup, consent release, token rotation or webhook edit.
The daily check, with a named source on each side
Pick one event you can count outside the ad and analytics stack. For ecommerce, that’s paid orders after excluding the payment states you reject. For leads, it’s valid form submissions or the CRM records they create. Keep the definition fixed on both sides.
| Field | Business side | Tracking side |
|---|---|---|
| Unit | Paid order or valid lead | Matching event at the destination |
| Window | One reporting window and time zone | The identical window and zone |
| Source | Shop, payment or CRM API | A named destination surface (below) |
| Identity | Order ID or lead ID | The same ID, where the destination exposes it |
Name the tracking source, because they answer different questions:
- GA4: the Data API with the transaction ID dimension, or the BigQuery export, gives you IDs, so you can compare order by order.
- Meta: the dataset’s
/statsedge returns hourly counts per event and can split browser from server events (checked 2026-10-17). ATA uses it to prove server delivery; it gives counts, not order IDs. Meta’s reference doesn’t state a delay. In ATA’s readbacks on 2026-10-07 the hourly buckets appeared about an hour late, and the response’s paging link echoed the access token, so strip it before you log the response. - A server-side HTTP 2xx is not a count. Google’s Measurement Protocol docs say it “does not return HTTP error codes, even if an event is malformed or missing required parameters” (checked 2026-10-17).
Attributed campaign conversions are a different measure. Windows, click matching and reporting delays change them, so keep them out of the delivery check.
Missing and extra events can cancel out
The common formula is (real actions - tracked events) / real actions × 100. Call it what it is, a signed count gap. With 100 paid orders and 92 Purchase events, it reports 8%. With 100 orders where 90 arrived and 10 extra events also arrived, it reports 0% while ten orders are missing. The extras can be unrelated events or repeat deliveries of tracked orders, and either one hides the loss.
Where both sides carry the order ID, split the result instead:
from collections import Counter

def reconcile(paid_ids, event_ids):
    """paid_ids: set of order IDs paid in the window.
    event_ids: list of order IDs on the destination's Purchase events."""
    seen = Counter(event_ids)
    missing = paid_ids - seen.keys()       # paid, never tracked
    unexpected = seen.keys() - paid_ids    # tracked, not a paid order
    repeated = {k: n for k, n in seen.items() if n > 1}
    gap = None
    if paid_ids:
        gap = (len(paid_ids) - len(event_ids)) / len(paid_ids) * 100
    return missing, unexpected, repeated, gap
That’s a sketch of the computation, not a production monitor. Fed the 90-plus-10 example, it returns a gap of 0 with ten missing IDs. If the ten extras are unrelated events, they show up as ten unexpected IDs; if they’re repeat deliveries, unexpected is empty and repeated lists them. Where only totals exist, as with Meta’s counts, you have the signed gap and nothing more. Say so in the alert: loss can’t be told apart from overcounting.
When there are zero real actions, the percentage is undefined. Record the counts and don’t call it healthy, because the business source may be broken too. Add an independent activity check, such as checkout sessions or total server requests, so the monitor can tell a quiet day from a dead pipeline. For low-volume accounts, compute daily and alert on a rolling seven-day window.
Don’t borrow a universal acceptable gap. Consent, browser loss, payment states and destination processing differ by setup. Measure a clean baseline for the account, write down why the remaining gap exists, and alert when the pattern changes.
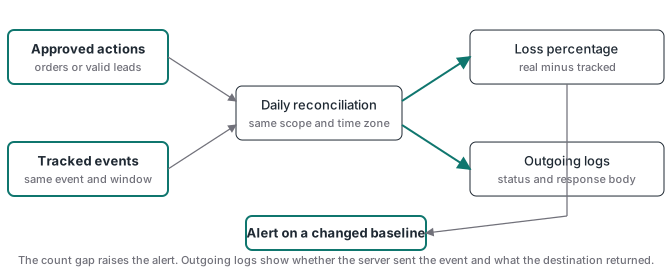
Alert rules: a settled lane and a provisional lane
A useful rule needs a minimum volume, a baseline and a delay that fits the account. Alerting on one missing event makes a small account noisy; alerting only at zero misses partial loss. For example, a rule might require at least 20 paid orders, more than 10% missing IDs, and two daily breaches in a row. Those numbers only illustrate the shape; set yours from the account’s normal range. Add separate checks for a full outage, unexpected or repeated IDs, stale credentials, and a customer list that stopped growing.
The incident above taught me the second lane. A check that only judges settled data (two days back) gives the right number for the report, but it’s about 40 hours late for the operator. My checks now keep the settled verdict and also judge yesterday and today with wide margins, as an internal warning. The data is already fetched; not judging it just means nobody is looking. The provisional lane warns; the settled lane confirms.
A sample alert carries everything the person on call needs:
WARN provisional  account=<account>  event=purchase  dest=GA4
window=<date> (<time zone>)
paid=<n>  tracked=<n>  missing=<n>  unexpected=<n>  repeated=<n>
signed_gap=<pct>  baseline=<range>  last_ok=<date>
recent_change=<last deploy, plugin or consent release>
Test the alert before trusting it, with four cases in a safe environment: a missing event, a duplicated event, an unavailable business source (which must report “unknown”, never zero), and a failed monitor job (which the heartbeat must catch). Then prove each one clears after recovery.
If part of the check is a synthetic browser run, watch for false alarms. In ATA’s own tests on 2026-10-06, Meta’s pixel sent nothing when the browser’s user agent contained HeadlessChrome and the pixel was a real dataset, while the same headless browser with an ordinary user agent sent the PageView at once. In that test, the default headless user agent made a working pixel look dead, so a synthetic check should set an ordinary user agent before it reports a pixel failure.
Outgoing request logs, and how long they last
Outgoing logs separate a tag that fired from a destination that accepted the request. Google’s server container debug guide shows the outgoing HTTP request and the full response in Preview, which is right for a controlled test. Preview is a live session, though. After an 8 a.m. alert about a failure that began overnight, you need persistent logs.
On Stape, turn on Outgoing request logging in the container’s Logs area. Its Logs documentation (checked 2026-10-17) sets limits that shape the whole routine:
- Logs are available only on paid plans.
- Pro and Pro+ keep the last 3 days; Business and Business+ keep 10; Enterprise adds log export.
- Monitoring is available from the Business plan up.
- Both log views offer a CSV download.
On a 3-day plan, a weekend failure you notice on Tuesday has already lost Saturday’s logs. That’s a reason to run the check daily and to download the CSV when an alert fires. Stape’s docs give Meta Conversions API and Google Analytics as examples of destinations whose outgoing requests appear; for any other template, send one test event and confirm its request shows up before relying on it.
An expired token usually shows up as a run of authorisation errors on one destination while the others stay at 200. Store a trace ID, event name, destination, timestamp, status and a bounded response body. Leave out personal data the diagnosis doesn’t need, and limit access and retention.
A 2xx proves an endpoint accepted the HTTP request. It doesn’t prove the destination counted the conversion, matched a person or attributed a campaign. Finish in the destination’s own test or diagnostics view. The sGTM debug ladder follows the same receipt-by-receipt approach.
When the alert fires, follow the event in order
Stop at the first missing receipt. Changing several layers at once destroys the evidence and can add duplicates while you repair a loss.
- Confirm real orders or leads exist in the expected business state.
- Check the live site outside an admin session, plus recent plugin, deploy, consent or cache changes.
- Trace one controlled browser request into the server container and save its host and trace ID.
- Read the matching outgoing request: status and response body.
- Check token expiry, permissions, destination IDs and endpoint configuration.
- Confirm destination receipt, then reconcile the test event by its order or lead ID.
- Record the cause, the release time of the fix and the first good event after it.
When two sources are both healthy and the gap is still growing, split by path the way the incident above was solved. Browser events and webhook triggers were flat, and only the server purchase had fallen, which put the fault in the join between them. The containers matched their backups, so nobody had edited them. Purchases from returning users held up better than from new ones, which meant new records weren’t being written under the key the webhook read. A screenshot of the data layer then showed the hashed email. The lasting fix is to key that kind of lookup on a stable opaque ID both sides carry unchanged, never on an email or phone taken from the browser, and to watch the lookup’s hit rate every day.
If the alert points to ordinary browser loss rather than a new break, compare the browser and server routes before changing anything. The event recovery guide explains how to measure them, and the Meta Conversions API with GTM guide covers the server route.
A handoff includes the monitor
A tracking setup is unfinished until someone can tell whether it still works. Put the business source, the destination surface, the reconciliation, the heartbeat, the credential owner and the log location in the handoff. Schedule the check daily and run the four-case drill once.
Advanced Tracking Academy is developing reusable web and server GTM containers for verified conversion flows, with guidance for testing each receipt; a monitoring template is not part of what’s shown here. ATA Edge already flags late webhooks and a change in matched orders in its panel.
For automated visits that distort the funnel denominator, the bot traffic measurement guide explains how to calculate a suspected share from your own logs before filtering.
For Instant Form campaigns, Meta Lead Ads downloads close after 90 days. Retrieve and save each contact separately from your conversion-event log.